What Is Personalized Learning?
Personalized Learning in Achieve uses a short diagnostic to understand each learner’s financial goals and challenges. Based on their responses, the platform recommends a custom playlist of learning modules tailored to their priorities—such as building credit, managing debt, or preparing for homeownership.
These personalized playlists are designed to increase engagement by aligning content with what matters most to each learner.
Note: If you’d like to add Personalized Learning to your program, please contact your Customer Success Manager.
What Learners Experience
When learners first access Achieve, they’re prompted to answer a few questions about their financial goals. Based on their responses, they receive a personalized playlist with recommended modules and tools.
These playlists are:
- Mobile-friendly
- Available in English and Spanish
- Automatically generated based on diagnostic responses
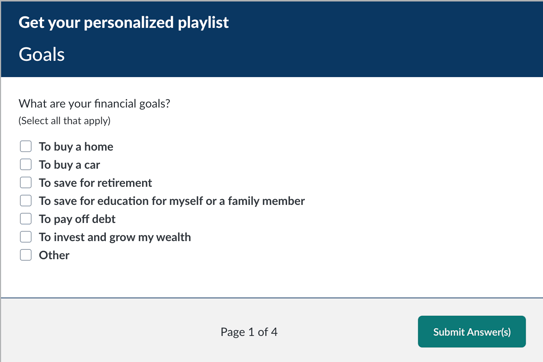
Example modules that may appear in a personalized playlist include:
- Considering Home Ownership
- Identity Protection
- Credit Scores & Reports
- Mortgages
- Taxes – The Basics
Where Admins Access the Dashboard
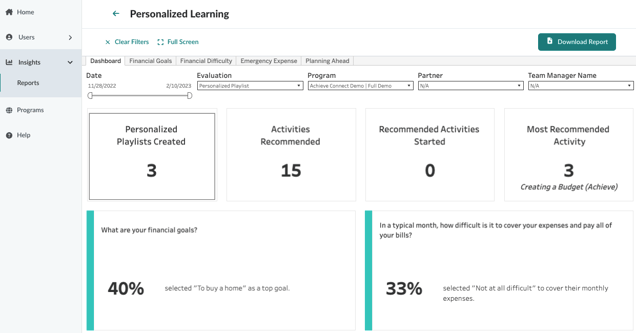
Admins can view the Personalized Learning dashboard in Foundry under the Insights > Reports section. This dashboard provides insights into how learners are interacting with their personalized content and what financial topics are most relevant to them.
Metric Definitions
- Personalized Playlists: Total number of personalized playlists recommended to users after completing diagnostics.
- Activities Recommended: Total number of activities started by users within a program.
- Recommended Activities Started: Number of activities started from personalized playlists.
- Most Recommended Activity: The content that appears most frequently on personalized playlists.
Chart Descriptions
- The top of the dashboard displays four key metrics in aggregate.
- The bottom section shows the top response (by percentage) for each of the four diagnostic questions.
- Clicking on a question reveals a breakdown of all responses and their share of total responses.
- Filters applied to the dashboard will persist when drilling into individual questions.
Note: Combined percentages may exceed 100% for multi-select questions.
Why This Dashboard Matters
This dashboard helps you:
- Understand what your learners care about most
- Track how personalized content is performing
- Identify which topics are most frequently recommended and engaged with
- Use data to inform future content strategy, marketing campaigns, or incentive programs
Admin Tips: How to Use This Data
Admins can use the Personalized Learning dashboard to:
- Tailor communications: Highlight the most popular topics in newsletters or onboarding emails.
- Refine incentives: Align incentive campaigns with the most recommended or most started activities.
- Support reporting: Use dashboard data to demonstrate learner engagement and program impact in quarterly business reviews (QBRs).
- Spot trends: Identify shifts in learner priorities over time and adjust content strategy accordingly.
For example, if “Building Emergency Savings” is consistently the most recommended activity, consider featuring it in your next campaign or adding a related incentive.
Related Features
- Custom Moments: If enabled, you can track conversions or engagement tied to specific actions within personalized playlists.
- Incentives: Personalized playlists can be paired with incentive campaigns to drive deeper engagement.
- Reporting: Use this dashboard alongside other reports like the Activity Summary or User Report for a full picture of learner behavior.